Drought update: How dry is NJ now, and how concerned should you be?
UPDATE as of Thursday 8/4...
The latest Drought Monitor was released this morning by the National Drought Mitigation Center. Despite recent rains, the area designating "Moderate Drought" in New Jersey has almost doubled, from 12% last week to just over 23% this week.
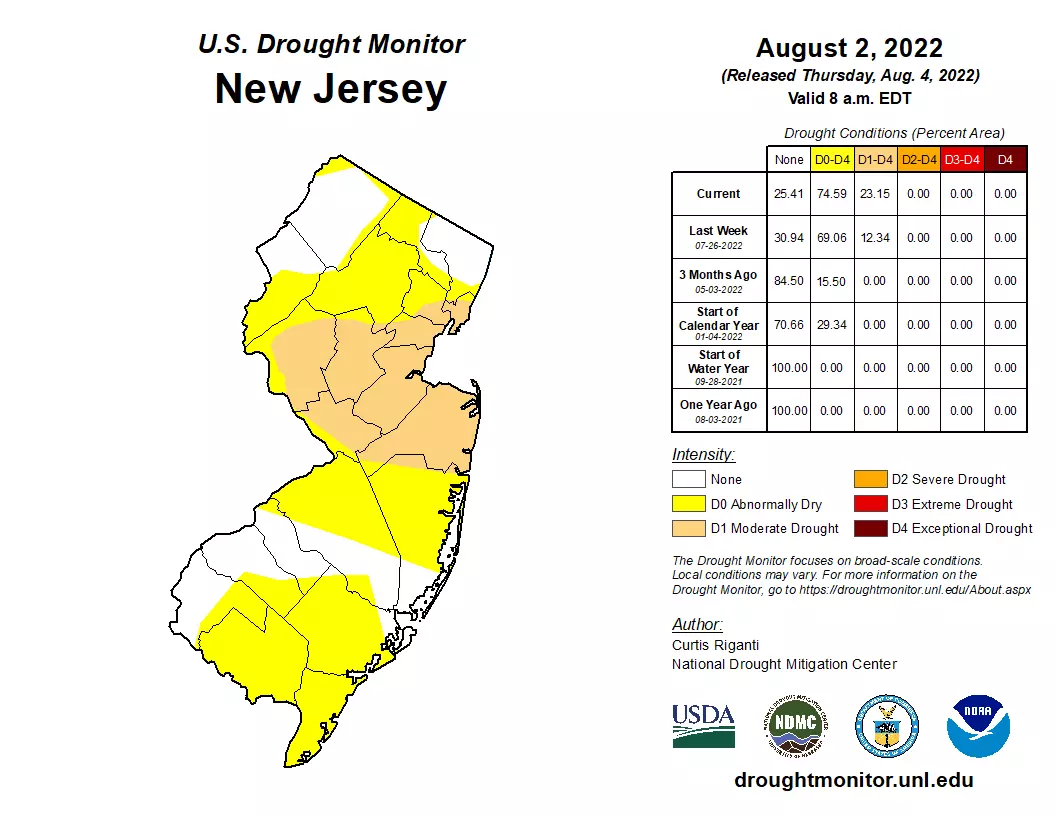
Pieces of Hudson, Essex, Union, Somerset, Hunterdon, Mercer, Middlesex, Monmouth, and Ocean counties are now in the "D2" category.
Meanwhile, about three-quarters of the state is now classified as abnormally dry. The only exceptions are along stretches in northern and southern New Jersey.
Parts of the drought-stricken area now need about 6 inches of rain to make up the deficit incurred over the last 60 days. And with each dry day, the situation continues to get more serious.
UPDATE as of Monday 8/1...
Rain, glorious rain! We had a batch of wet weather slide through New Jersey overnight. Top rainfall totals approached an inch. It makes a little dent in our drought status — maybe rewinding the clock about a week. But it was not a drought buster — the rest of my concerns and analysis below is still valid.
ORIGINAL POST from Sunday 7/31...
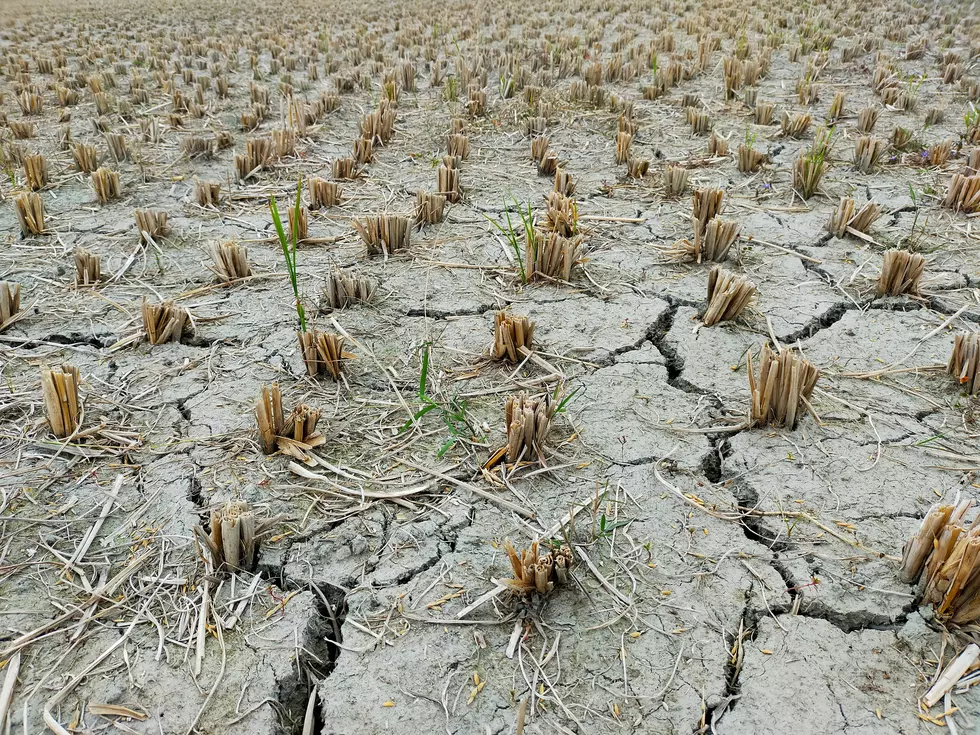
As of this week, part of New Jersey — 12.34 percent of the state, to be exact — is officially in drought. (Cue dramatic music.) Our recent stretch of dry weather has been a hot topic of conversation lately. Lawns are brown, streams are drying up, and voluntary water restrictions are already in effect.
Since the Dust Bowl of the 1930s, the weather enterprise has drastically improved and refined the way we analyze and mitigate abnormally dry conditions. Drought management is a truly multi-disciplinary and cross-agency responsibility, involving atmospheric scientists, hydrologists, climatologists, agronomists, urban planners, resource managers, farmers, and more.
As summer rolls on, and with more horrendous heat on the horizon, I wanted to take a deep dive on New Jersey's current drought status. (Data and graphics are current as of July 30.) Specifically focusing on just how dire our situation is. And how bad it could potentially get.
(Later this week, I plan to write more about the specific causes and effects of drought in the Garden State.)
1.) Current status?
This graphic is kind of "giving away the answers to the test" before we talk about the factors that lead to drought. But I share this graphic often, as it represents our "official" dryness. Consider it a "finger on the pulse" of our drought status.
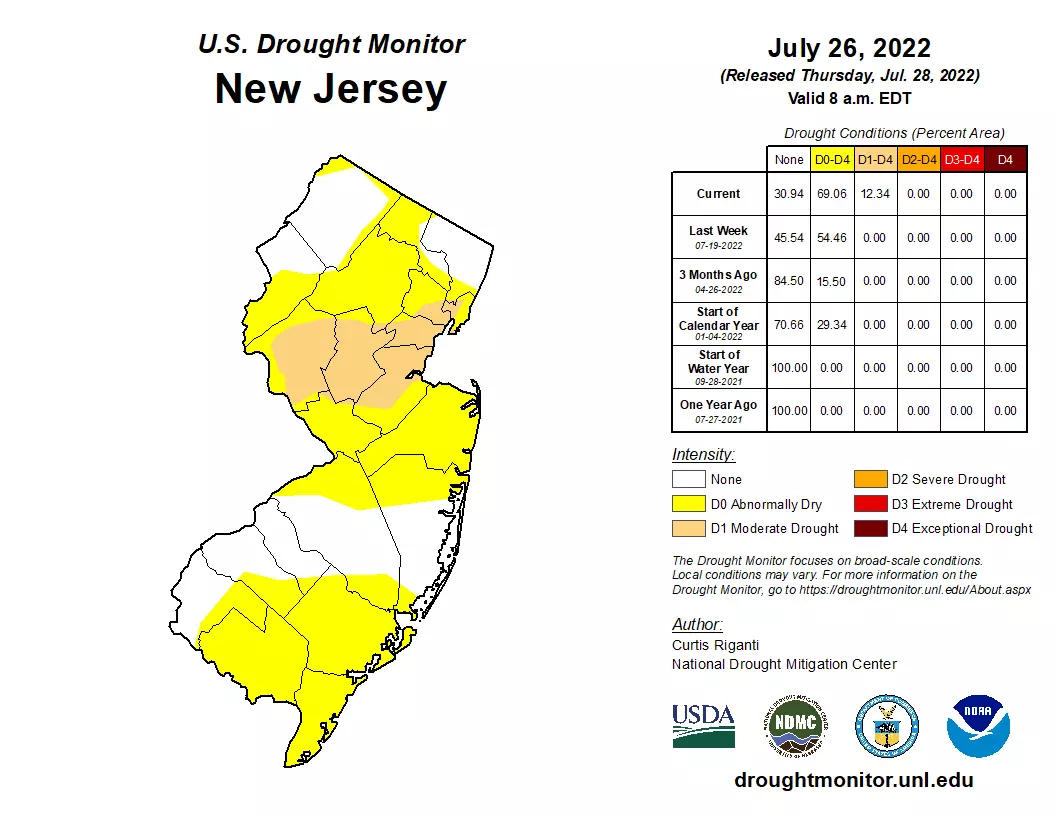
The Drought Monitor is published by the National Drought Mitigation Center every Thursday morning, using data through the previous Tuesday morning. It is largely an objective analysis, using a few parameters and indices to gauge how dry the weather, soil, and waterways have been. There is a subjective piece too, as numerous contributors and stakeholders recommend how the drought map should change week to week.
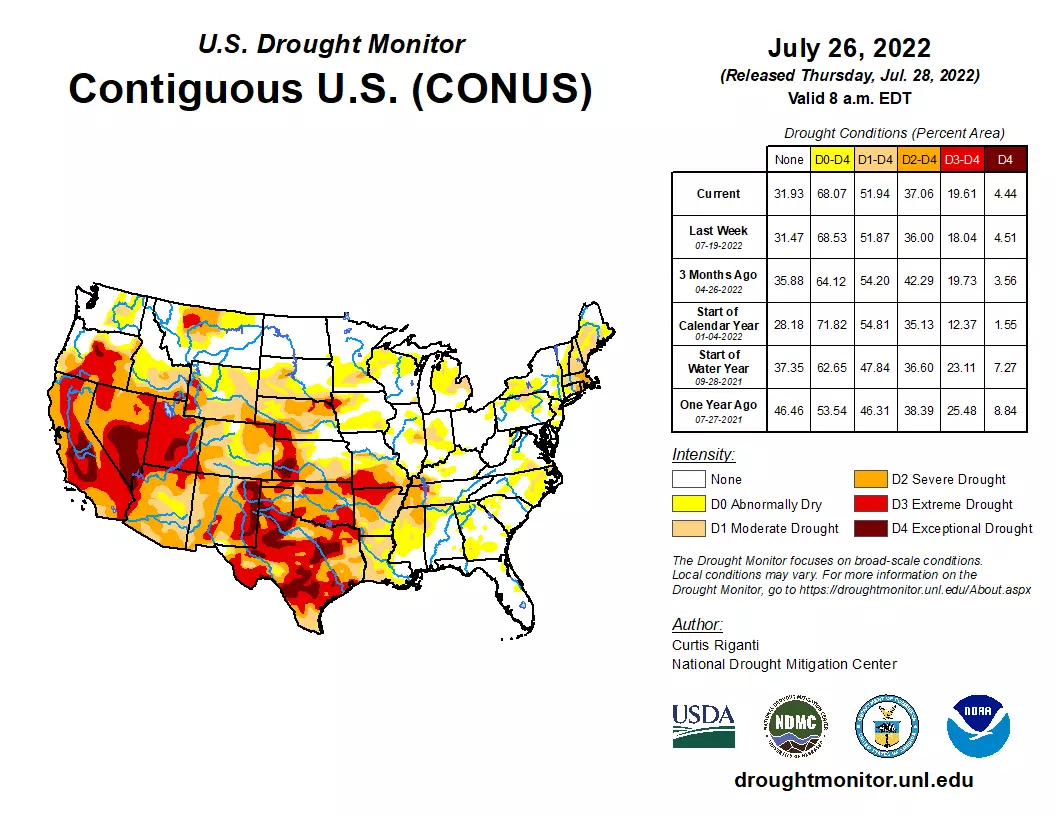
I always share the New Jersey specific map, but the Drought Monitor is produced for the entire country. As of July 26, almost 52 percent of the contiguous United States are in some stage of drought.
The five colors on the map represent the five drought categories, each with escalating levels of impacts and urgency:
—D0 - Abnormally Dry... Yellow... Short-term dryness, with minor effects.
—D1 - Moderate Drought... Peach... Officially in "drought" status. Streams and reservoirs start to run low, necessitating voluntary water restrictions. Some damage occurs to crops.
—D2 - Severe Drought... Orange... More water shortages and restrictions. More loss to crops.
—D3 - Extreme Drought... Red... Widespread water and agriculture issues.
—D4 - Exceptional Drought... Maroon... A water emergency.
As the map above shows, a piece of central New Jersey was upgraded to D1 - Moderate Drought. That's the first time we've seen that level of drought since March and April of this year.
The last time we were in D2 was in the fall and winter of 2016-17.
And New Jersey's last significant drought, with D3 and even a brief period of D4 occurred in 2002.
2.) How long?
There are dramatic variations in how dry different areas of New Jersey are — I'll talk more about that in a moment.
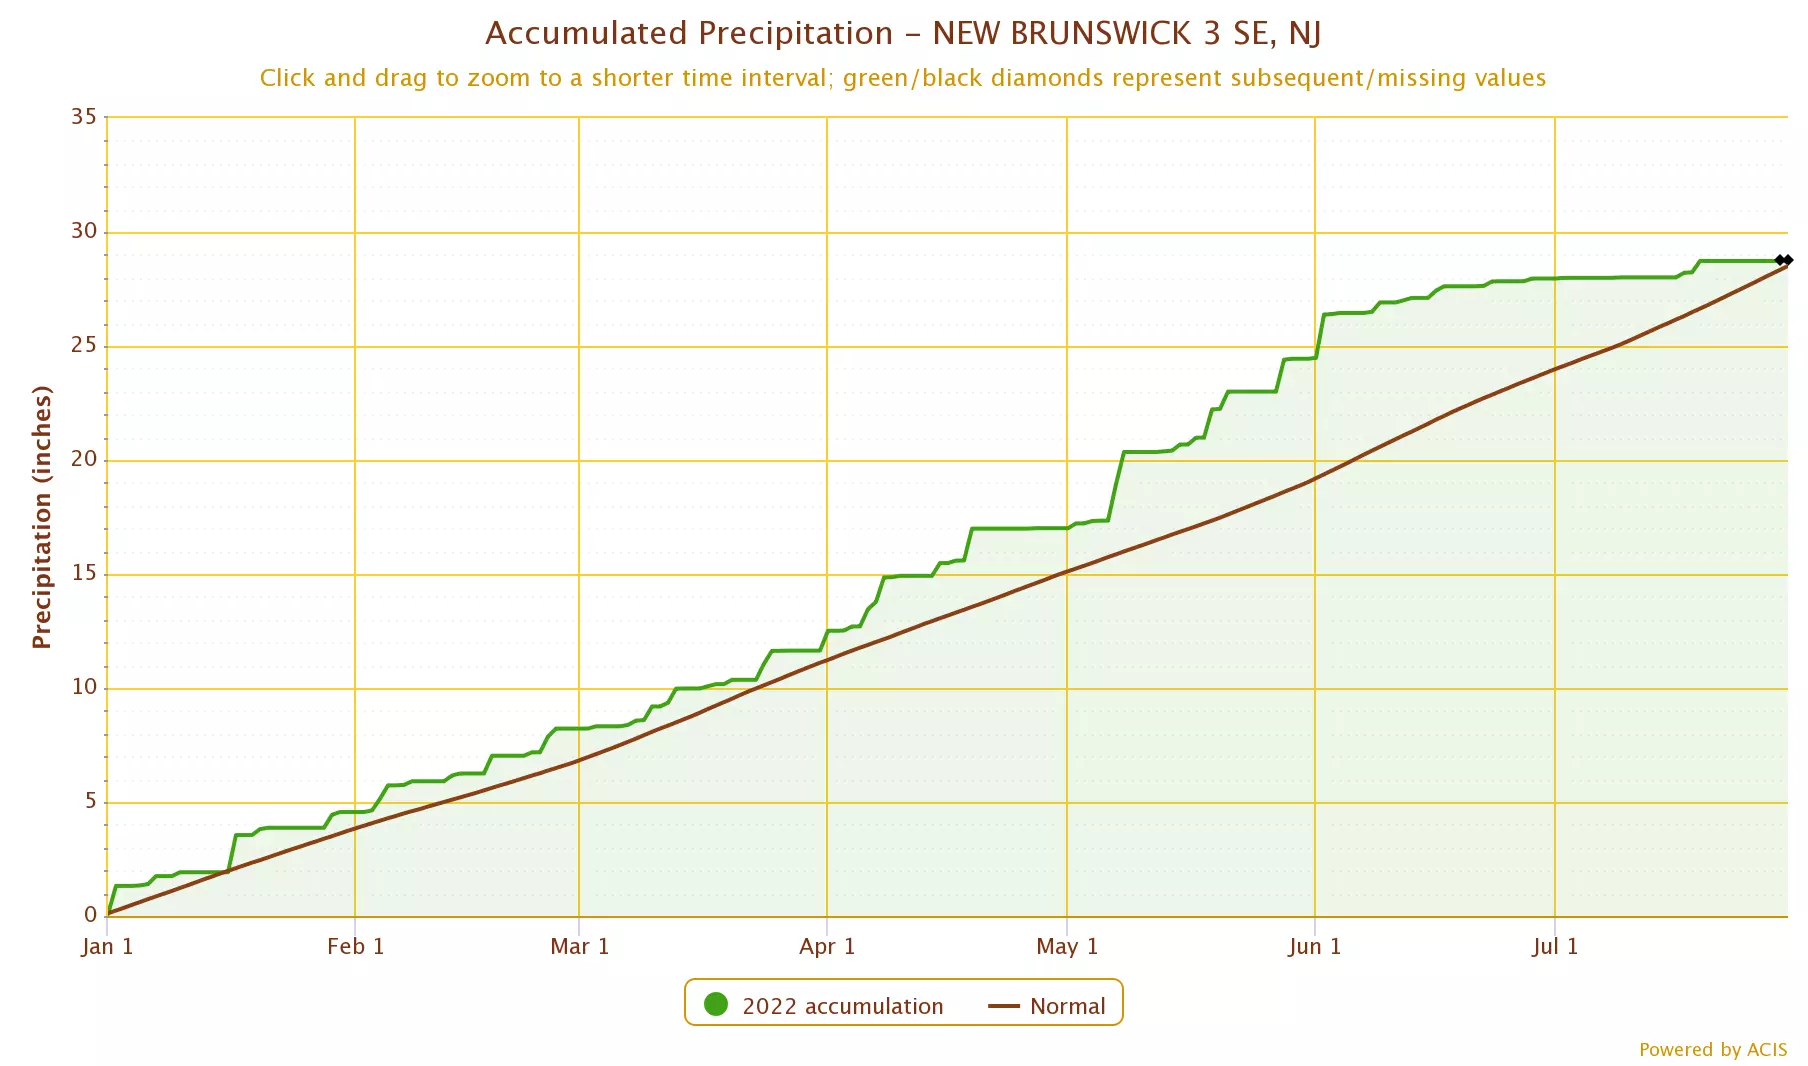
But we can get a sense for how long rainfall has been running behind by looking at weather data. In this case, let's look at year-to-date precipitation at the Newark Liberty Intl AP station. (I have been critical of that station's recent temperature record, but the rainfall data looks fine.)
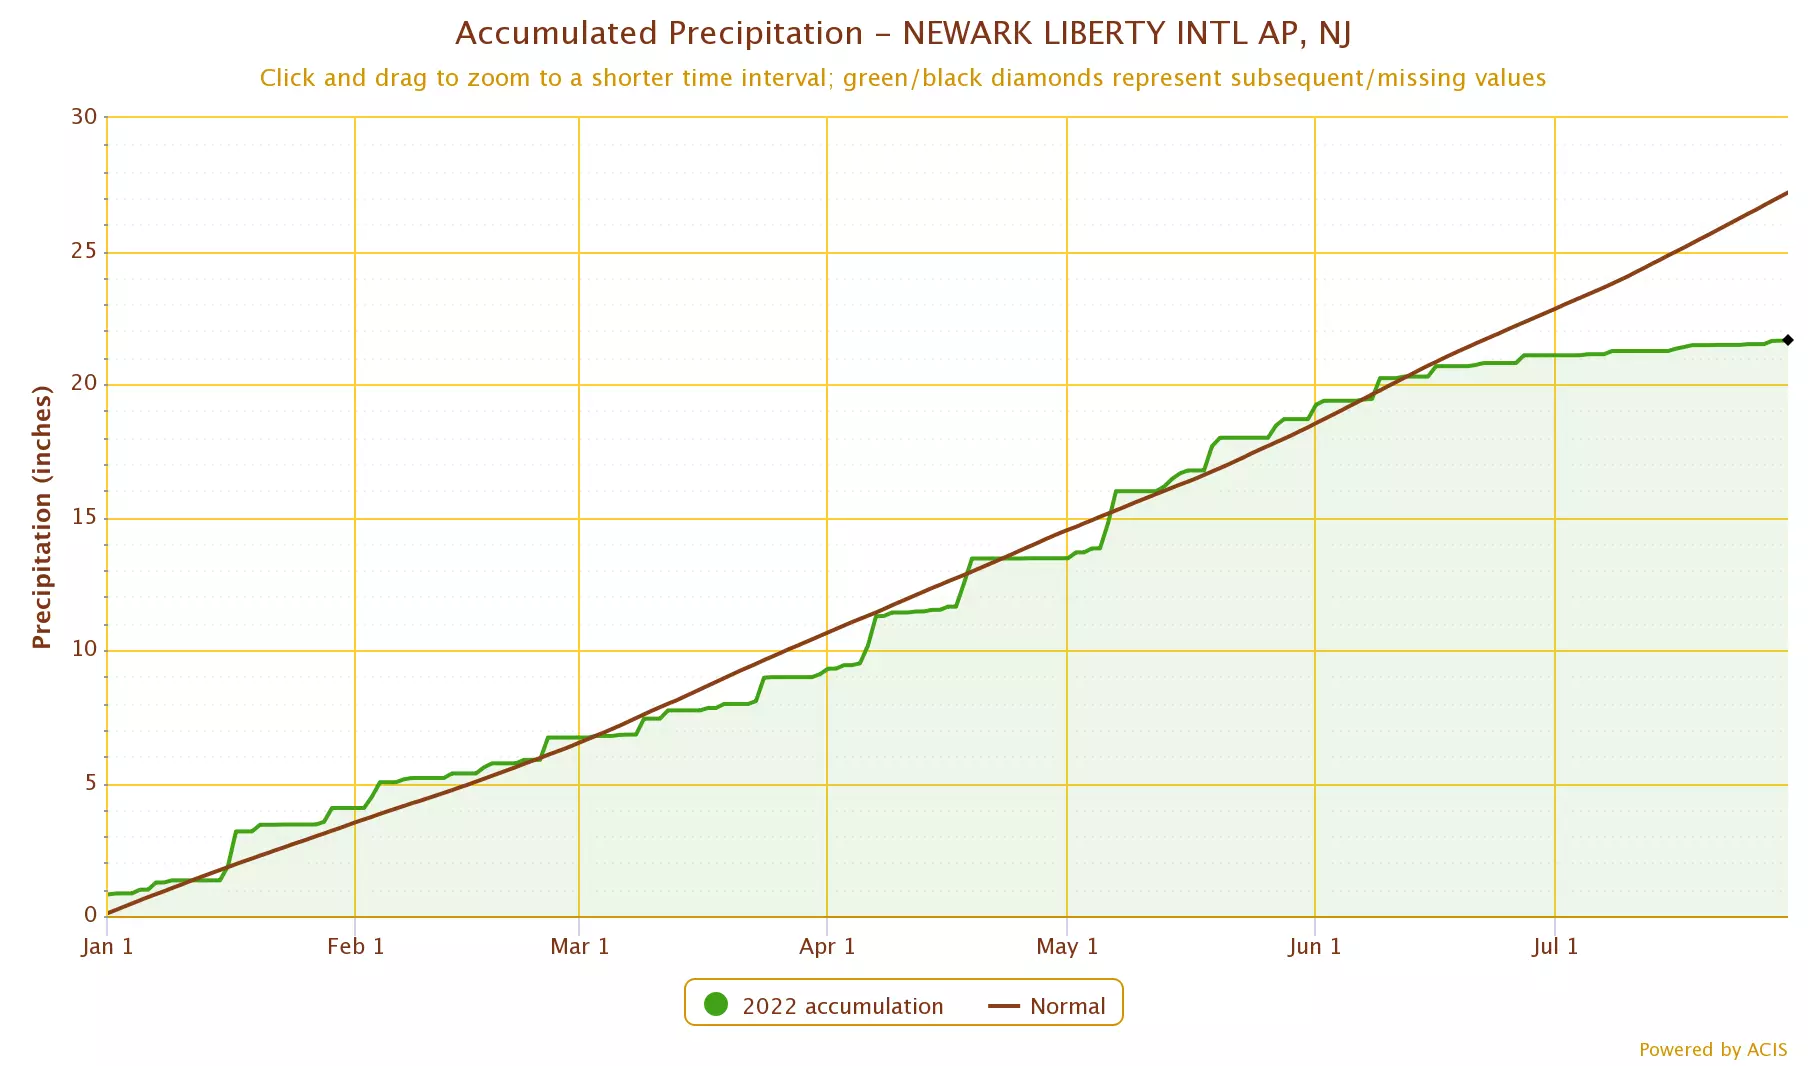
The green line (and area) shows cumulative precipitation since January 1. And the brown line represents the corresponding normal values. ("Normal" in the weather world refers to a set 30-year long-term average.)
For the first five months of 2022, rainfall at Newark flirted with normal. January and February ran a bit above. And we fell a bit behind through March and April. But nothing big yet.
And then, once June rolled around, it just stopped raining. The two lines on the graph just keep growing farther and farther apart. As of July 30, KEWR is running about 5 inches below normal for the year. And it is clear that the shortfall has occurred in the last 45 to 60 days.
FYI, a similar (although less dramatic) trend is visible at the Flemington cooperative station.
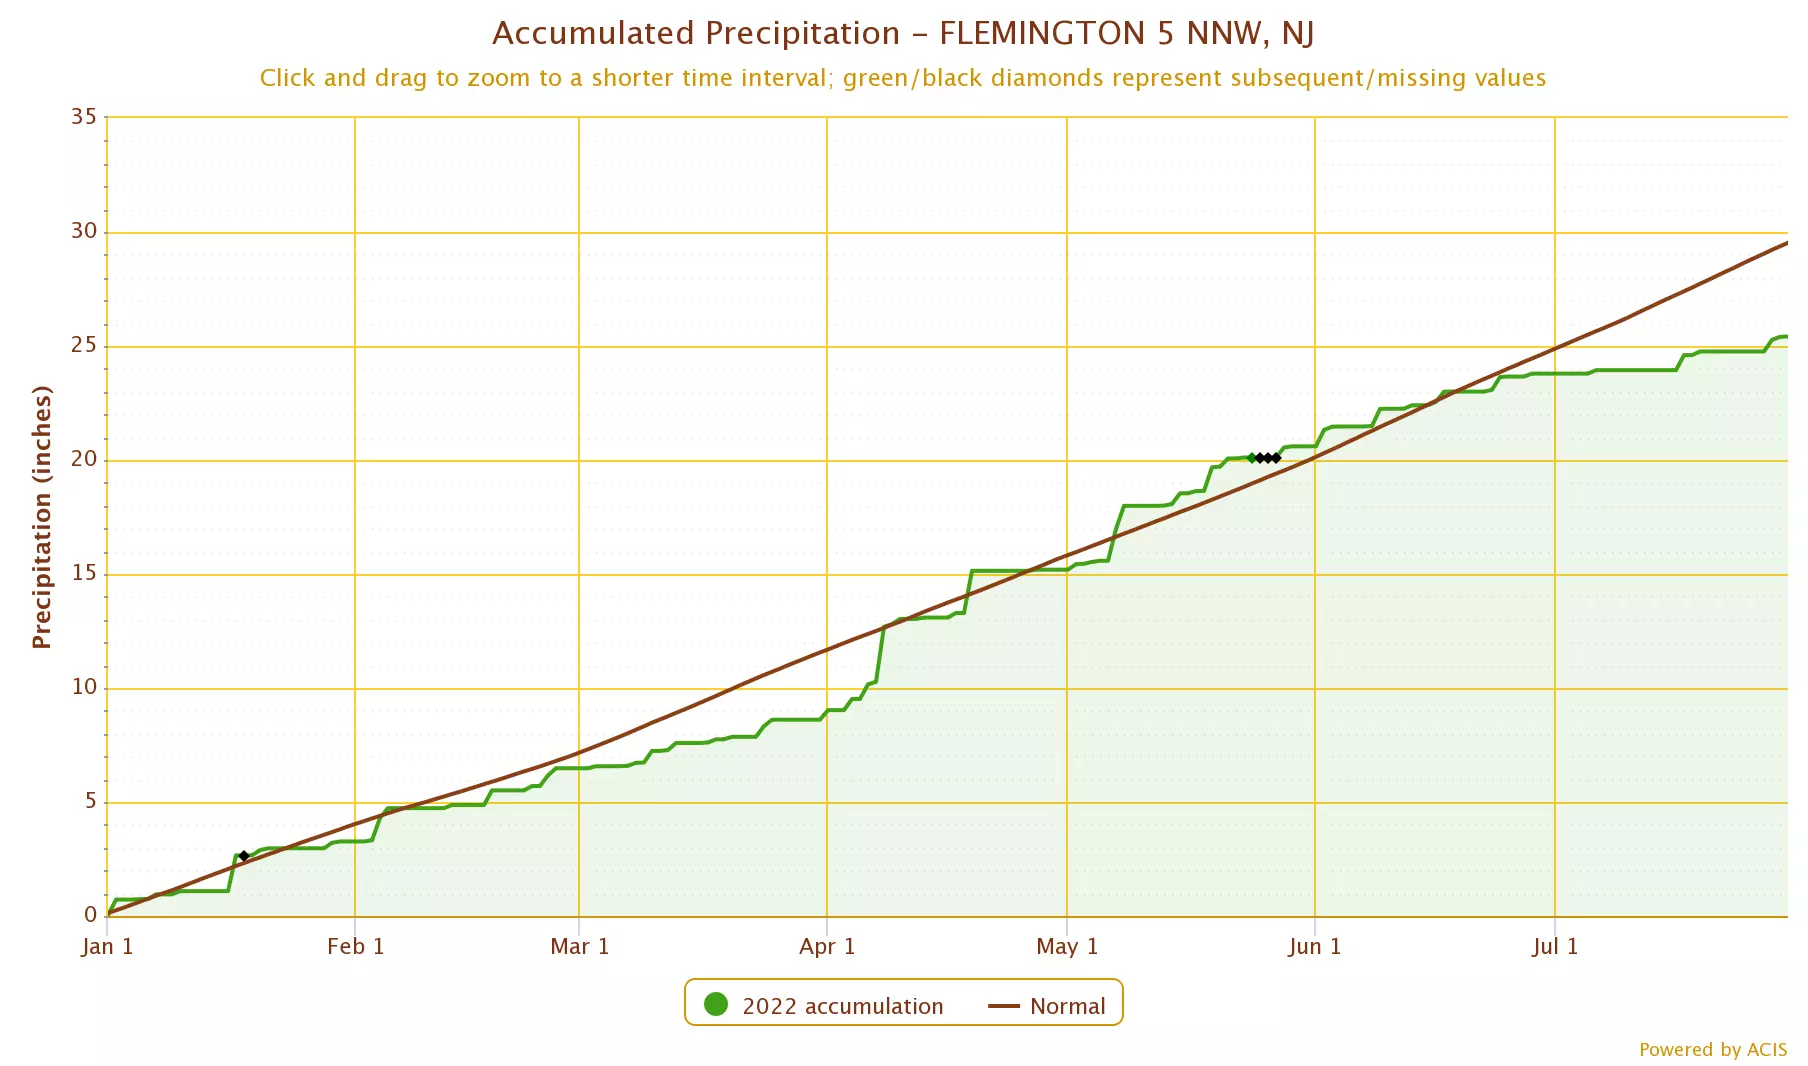
New Brunswick too, although it's not as apparent as that gauge had been running a healthy surplus of precipitation through the first segment of the year.
3.) How bad?
Summer is supposed to be New Jersey's rainy season. On average, July and August are the #1 and #2 wettest months of the year, respectively.
But this summer, every batch of thunderstorms has been so hit-or-miss.

The "miss" area is very clear on the map above. The four counties colored red — Mercer, Middlesex, Somerset, and Union —are more than 50% below normal precipitation over the last two months. It's worth pointing out that Hunterdon, Essex, Hudson, and Monmouth counties are very close to that threshold too, with at least a 4-inch deficit this summer.
So in order to "catch up" and completely stave off drought, we need a 4 to 6 inch rain event. First of all, those are excessively rare — approximately a 5 to 25 year storm, according to NOAA Atlas 14. Second of all, if we get a half-foot deluge of rain in a short period of time, that will raise significant flash flooding alarm bells. (See: Ida, September 2021.)
Also keep in mind, that deficit will continue to deepen with every single day we don't get appreciable rain. On the order of 0.10" to 0.15" per day, going by the 30-year normal daily precipitation.
4.) Where is it worst?
We can break apart the last graphic into its two components — 60 day precipitation vs. 60 day normal precipitation — to add some precision and context to our recent boom vs. bust precipitation.

Some observations here:
1.) The most parched part of the state is clearly between Interstate 78 and Interstate 195. Some weather stations there have only picked up between 3 and 4 inches of rain in 60 days.
2.) South Jersey has been in "abnormally dry" status on the drought monitor for quite a while. You can see that trend continues for much of Cape May, Cumberland, and Atlantic counties.
3.) The normals map is boring, with only two contours showing up. (Normals data is smoothed, so that is not surprising.) But the color scale of these two visualizations are the same. If we had close to normal precipitation, the left map would be purple. Therefore, the only part of the state not seeing drier-than-usual conditions is NW NJ — pieces of Sussex and Warren counties.
5.) Any Rain Coming?
Hopefully I have made a compelling case that we need some serious rain soon to avert more serious drought effects and rules. (And if you don't believe me, refer to those brown lawns, dry streambeds, and voluntary water restrictions I mentioned earlier.)
Is there any relief in sight? Perhaps.
In the short-term... We will see a batch of spotty rain and thunderstorms Sunday evening through Monday morning. A heavy downpour in just the right spot could help a little bit. (By the numbers, at least.) Models have also hinted at a more prolonged rainfall event around next Friday-Saturday. Best case scenario: Parts of the state could pick up 2+ inches of rain over the next seven days. That doesn't pull us out of the rainfall hole completely, but it would be a big help.
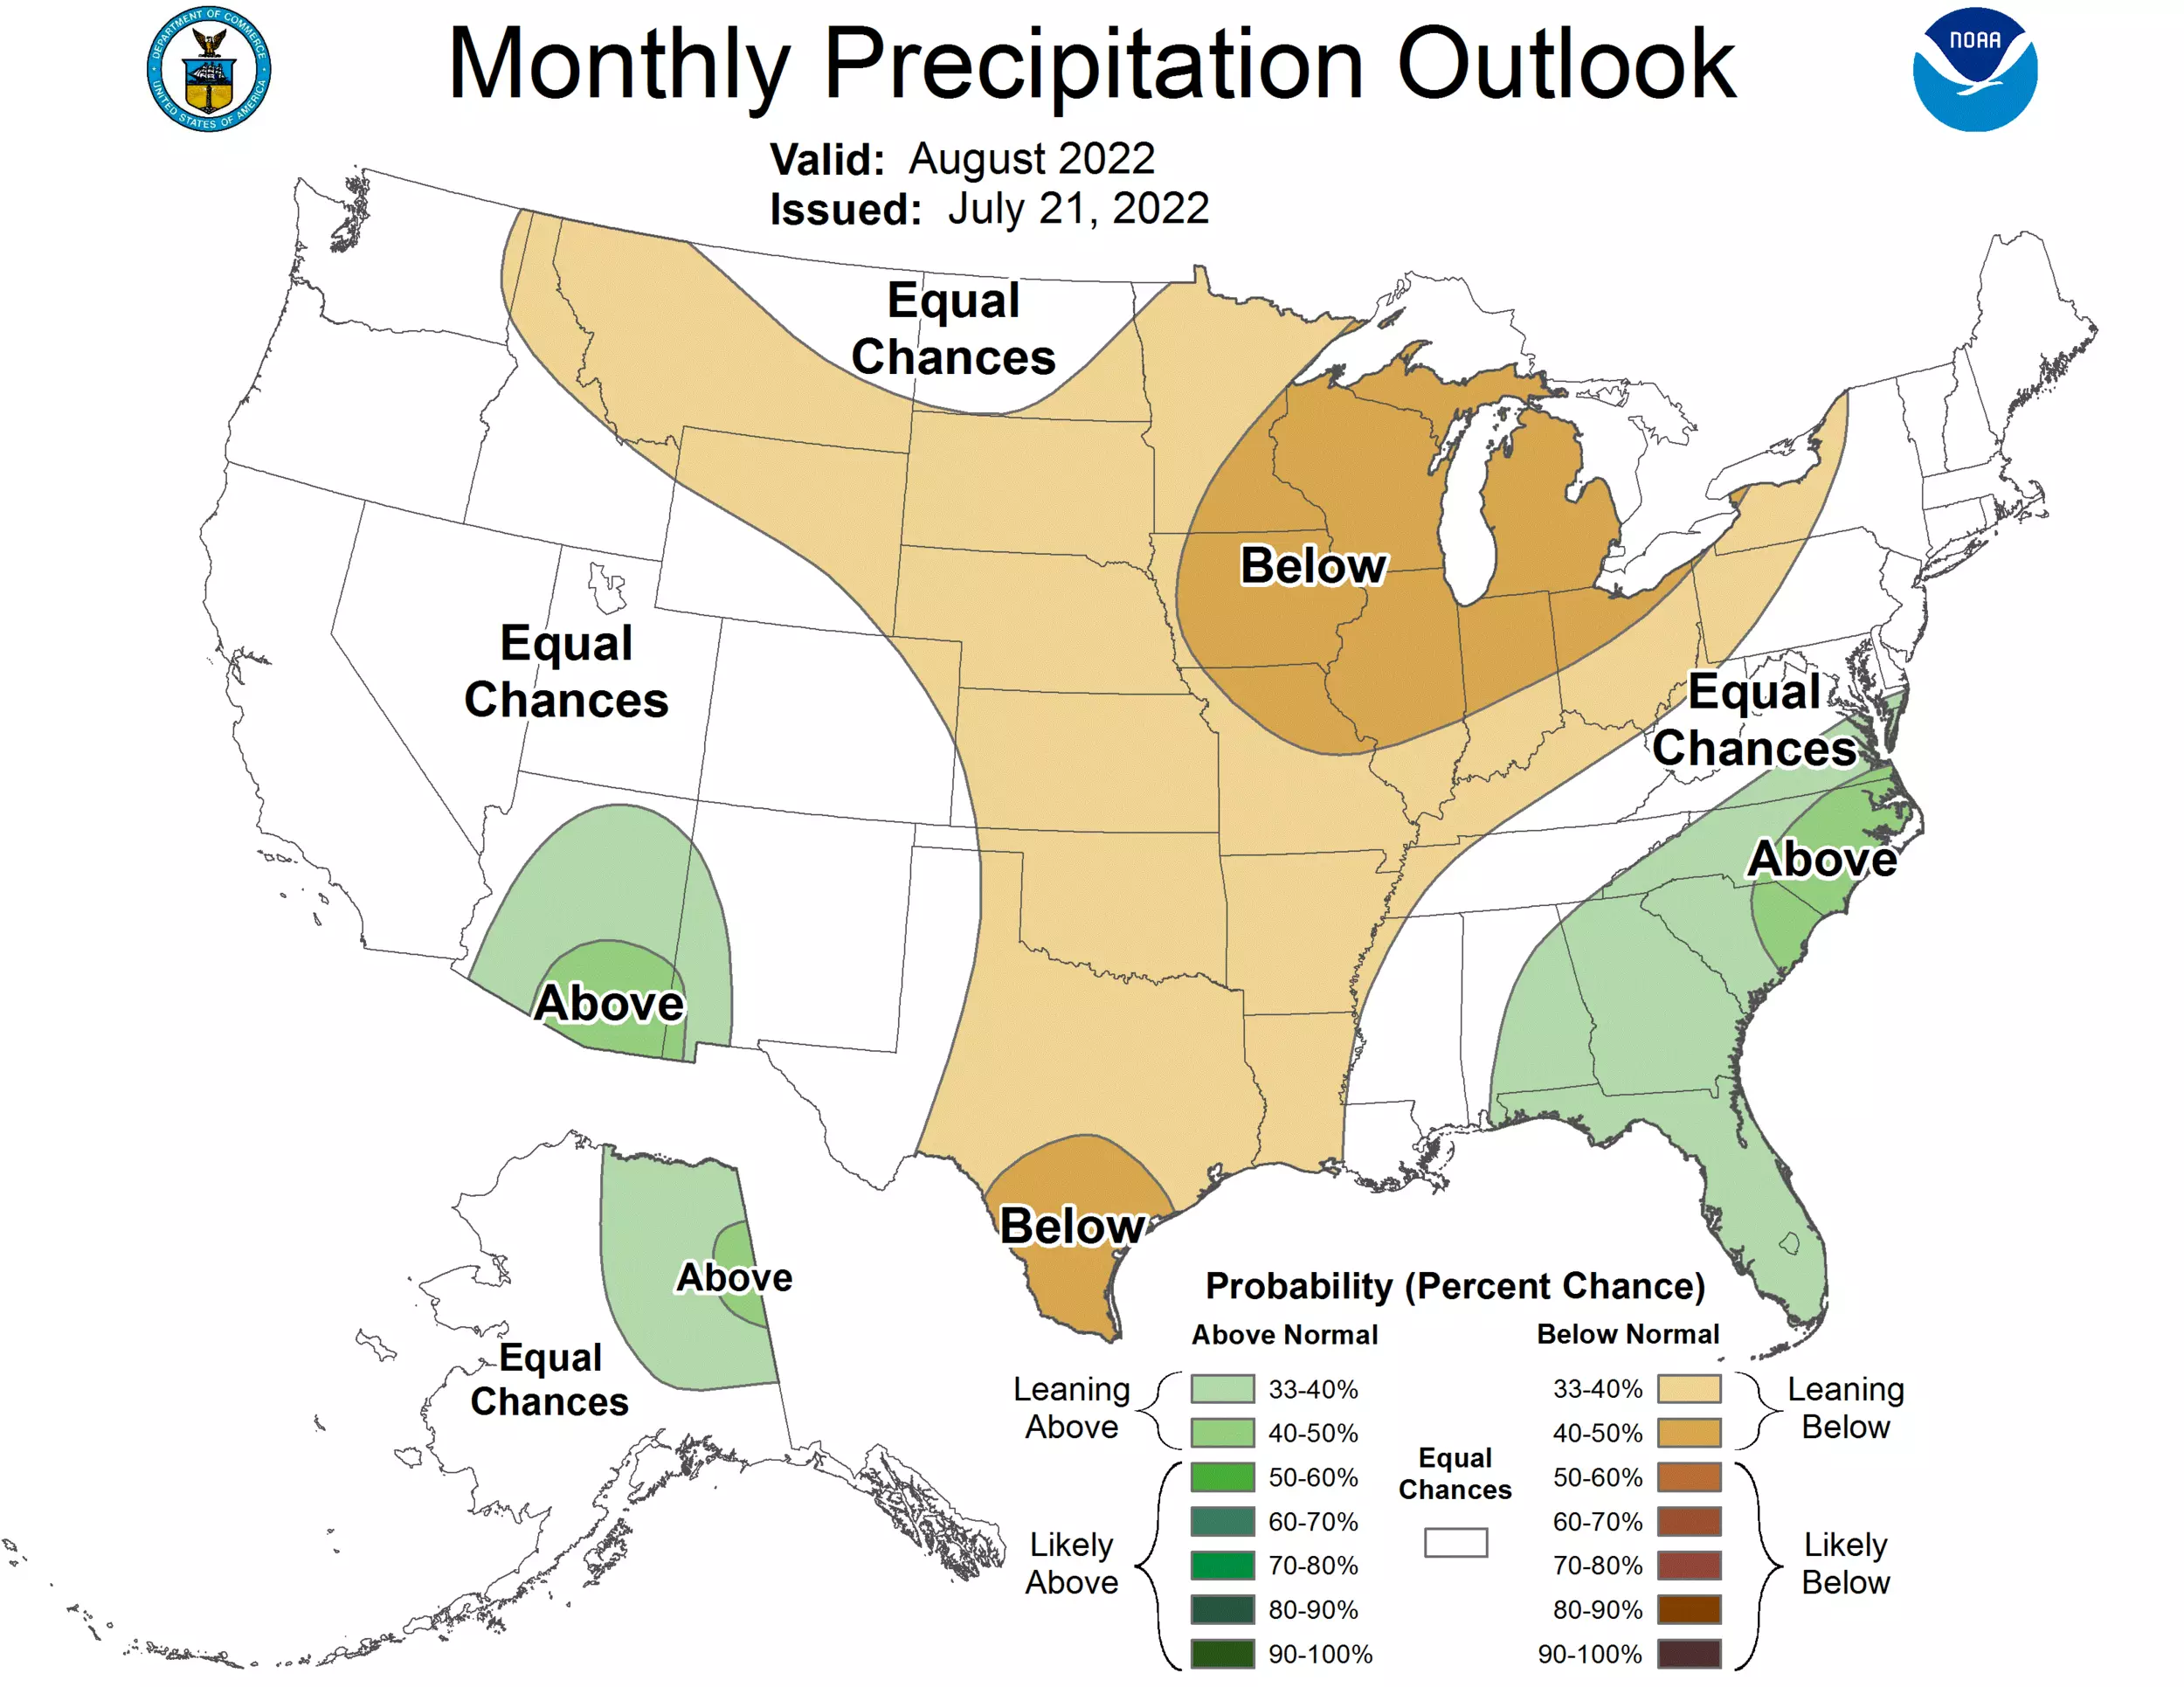
Looking long-range... The Climate Prediction Center's latest outlook for August puts New Jersey as having equal chances of above-normal and below-normal precipitation. I read that as potentially good news — at least we're not under a deathly heat ridge, which would guarantee to dig us deeper and deeper into the drought hole. If we can tap into that juicy dominant storm track over the southeastern United States, that could lead to a series of super soaker storms and some healthy rain. However, I highly recommend you consider this outlook with a grain of salt — climate predictions like this are imprecise and overly generalized.
There is one more important element to consider. We are in the middle of hurricane season. In fact, the average peak for tropical activity in the Atlantic is early September. Any direct (or indirect) pass by a tropical storm could produce (or enhance) rainfall. Some of New Jersey's most prolific drought busters in history have been ocean-borne hurricanes. (Cold-season nor'easters too.)
Final Thoughts
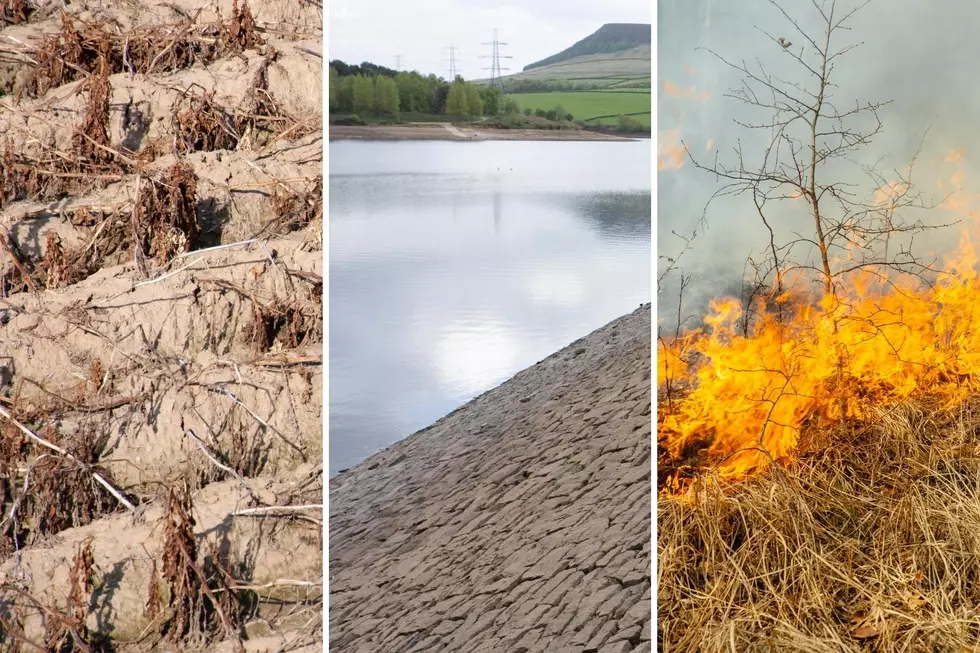
Drought is serious business. And it can spiral very quickly — dry weather contributes to even more dry weather.
We will be talking a lot more about drought in the days and weeks (and months?) to come. No need to panic yet, but please take it seriously.
Dan Zarrow is Chief Meteorologist for Townsquare Media New Jersey. And, when needed, Chief Hydrologist too. Follow Dan on Facebook or Twitter for your latest weather forecast updates.
The most expensive weather and climate disasters in recent decades
Gallery Credit: KATELYN LEBOFF
What would happen to NJ if we were attacked by nuclear weapons?
Gallery Credit: Eric Scott
More From Beach Radio